3 min read
Today, we’re excited to share our first 360: The Community-Led Growth Report with the community.
The report offers insights and actionable next steps based on 141 communities at various stages of longevity, maturity, and growth across the product-led growth, open-source, commercial open-source, and modern SaaS industries, with community membership ranging from 50 to 100,000+ individuals distributed globally. In total, our analysis highlights trends and inflection points across a cumulative 7.5+ million community members.
It’s our hope that these insights help inform what you and your organization do next with your community to empower your members, positively impact your business, and continue building products and experiences people love.
So, what did we find?
We’ve highlighted five key insights from the report below, covering common questions ranging from engagement rates and business impact to community responsiveness. To see all of the findings, read the full report.
1. Consumers want to engage with your company where they already spend their time. On average across the 141 communities included in this analysis, organizations engage with their communities across five surfaces. The two most common surfaces that community members engage across are Twitter (91%) and GitHub (67%).

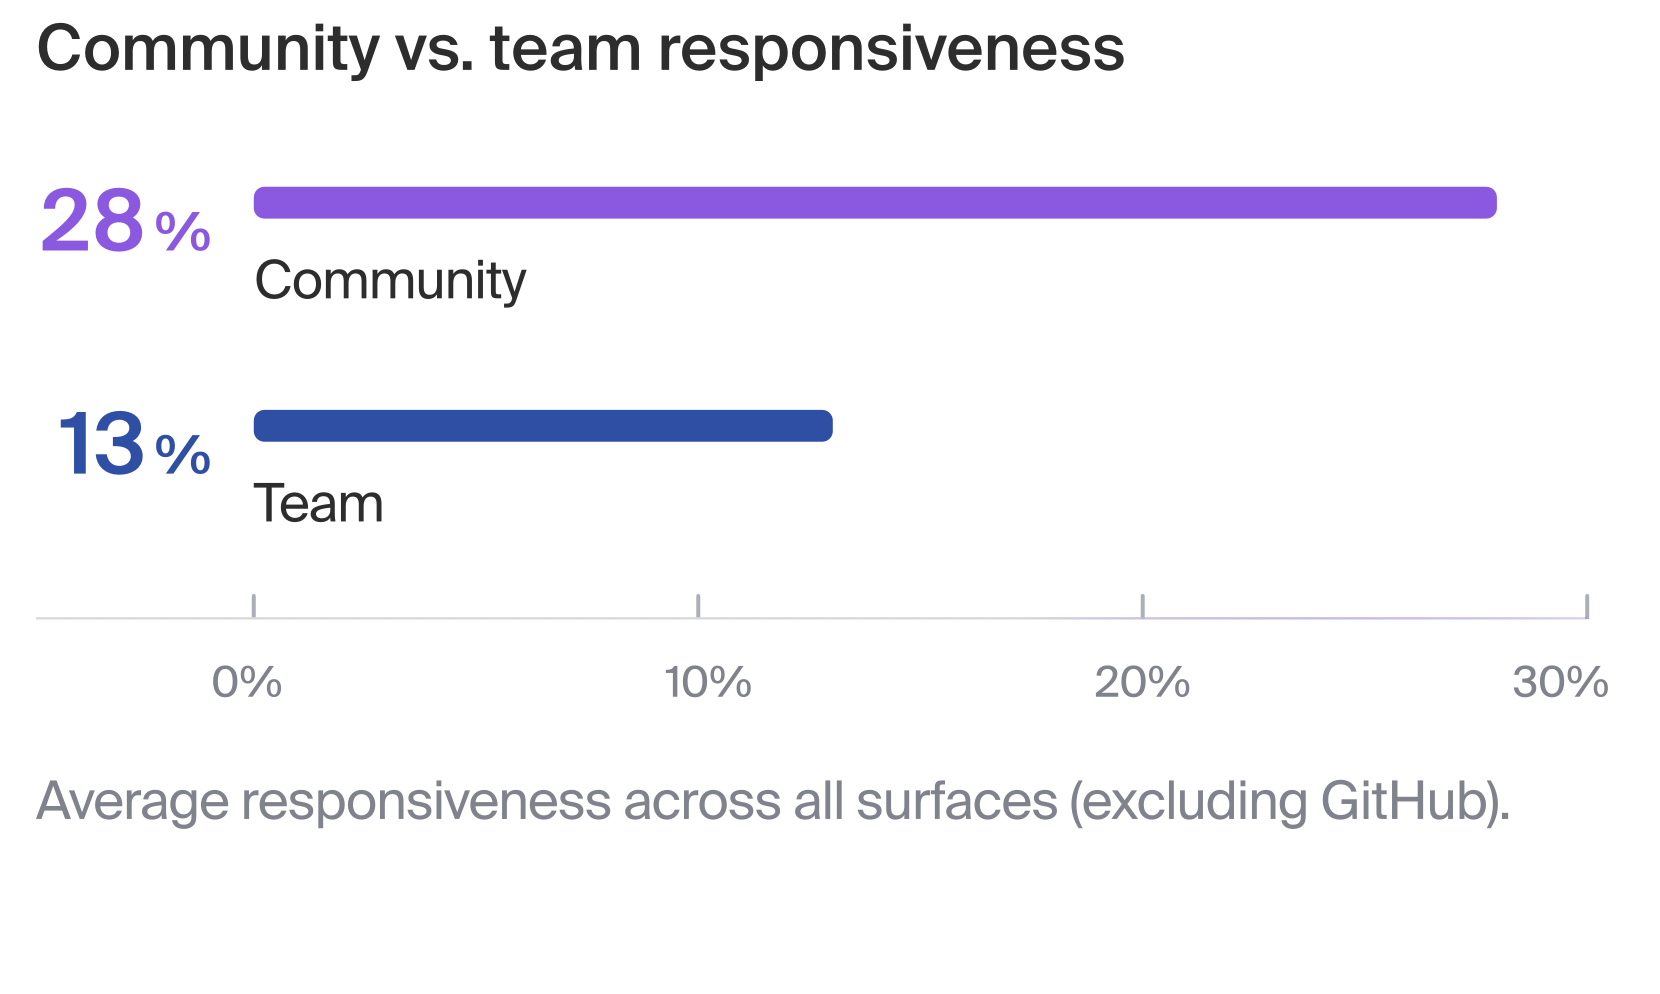
2. Community is a flywheel for education and activation. Across all surfaces, excluding GitHub, community members respond to each other more frequently (28%) than an organization’s internal teams (13%). To further extend education and activation, 30% of companies already have a champions program, and the vast majority of customers we speak with aim to build one in 2023.
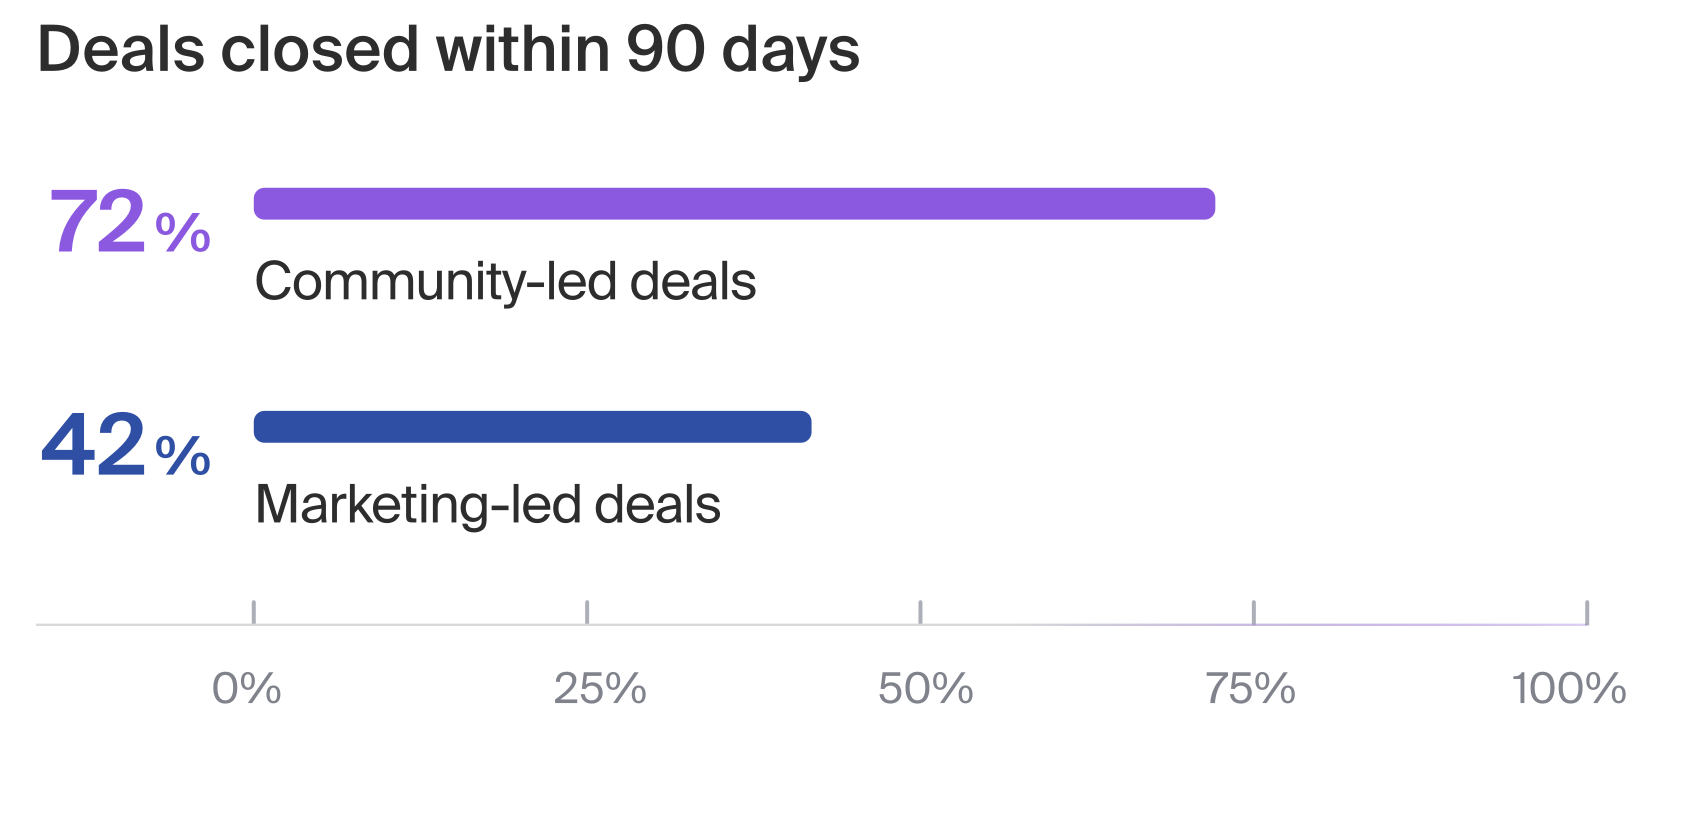
3. Community accelerates deals and drives new business. Cohort-based analysis showed that 72% of community-led deals closed within 90 days compared to 42% of sales and marketing-led deals.
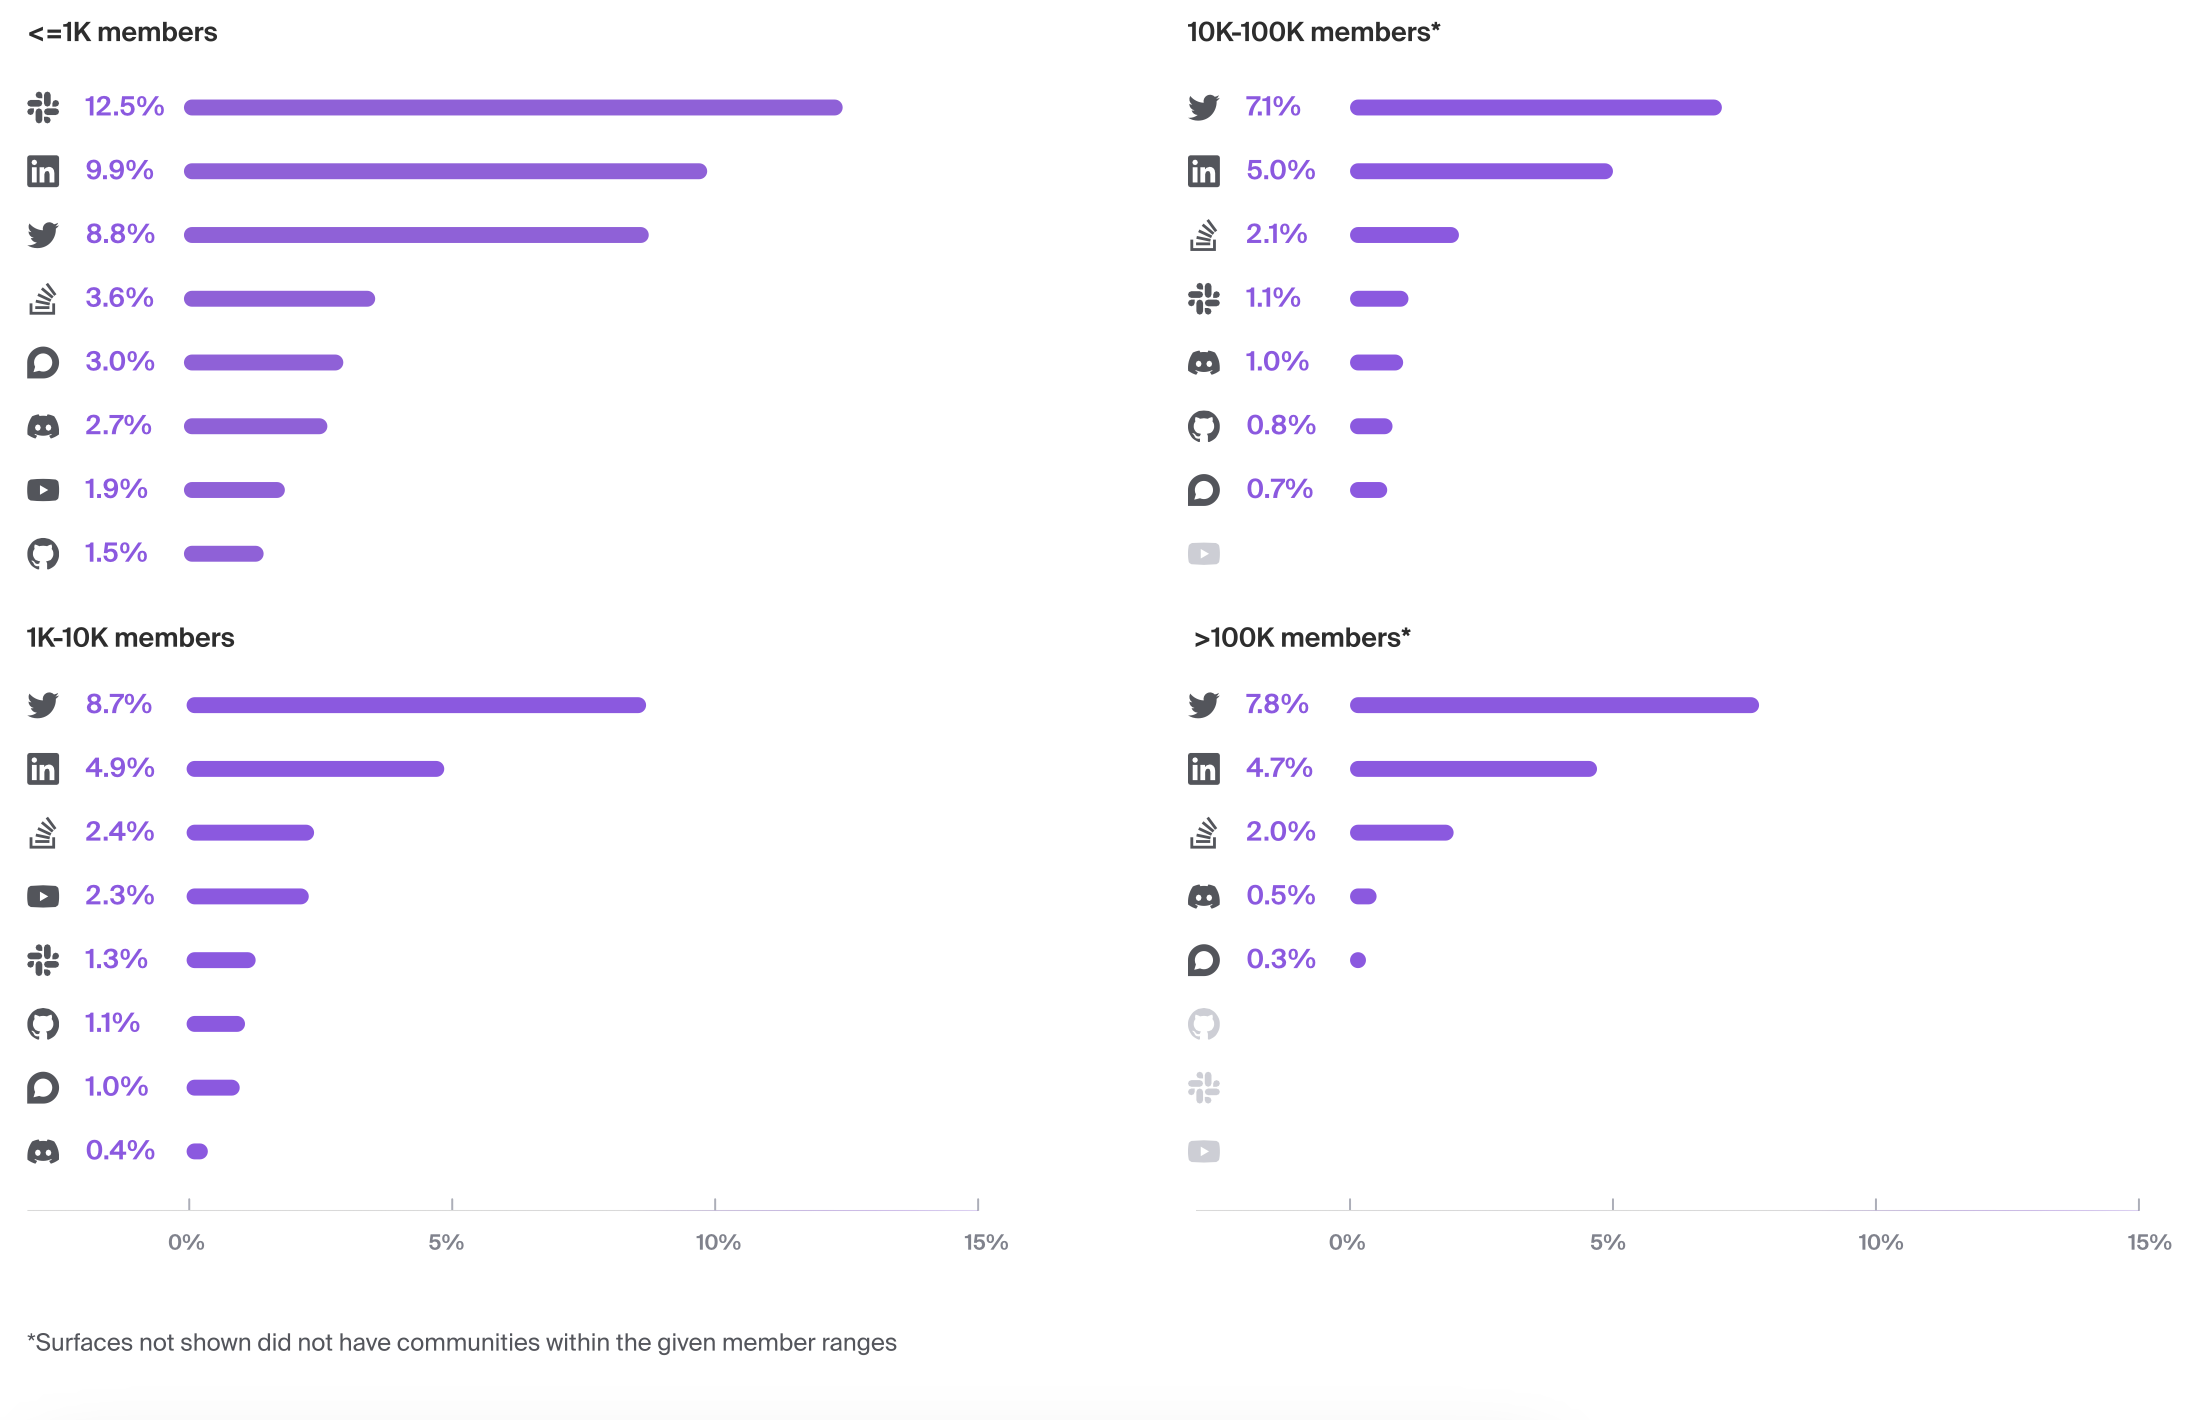
4. Engagement varies across surfaces and community sizes, and you should know you are likely doing just fine. The average engagement rate across all community surfaces is 2% - 12%. Smaller communities tend to have higher engagement rates. As communities scale, real-time chat applications see the biggest dropoff in engagement while social networking platforms like LinkedIn and Twitter see minimal dropoff in engagement rates even as communities grow larger.
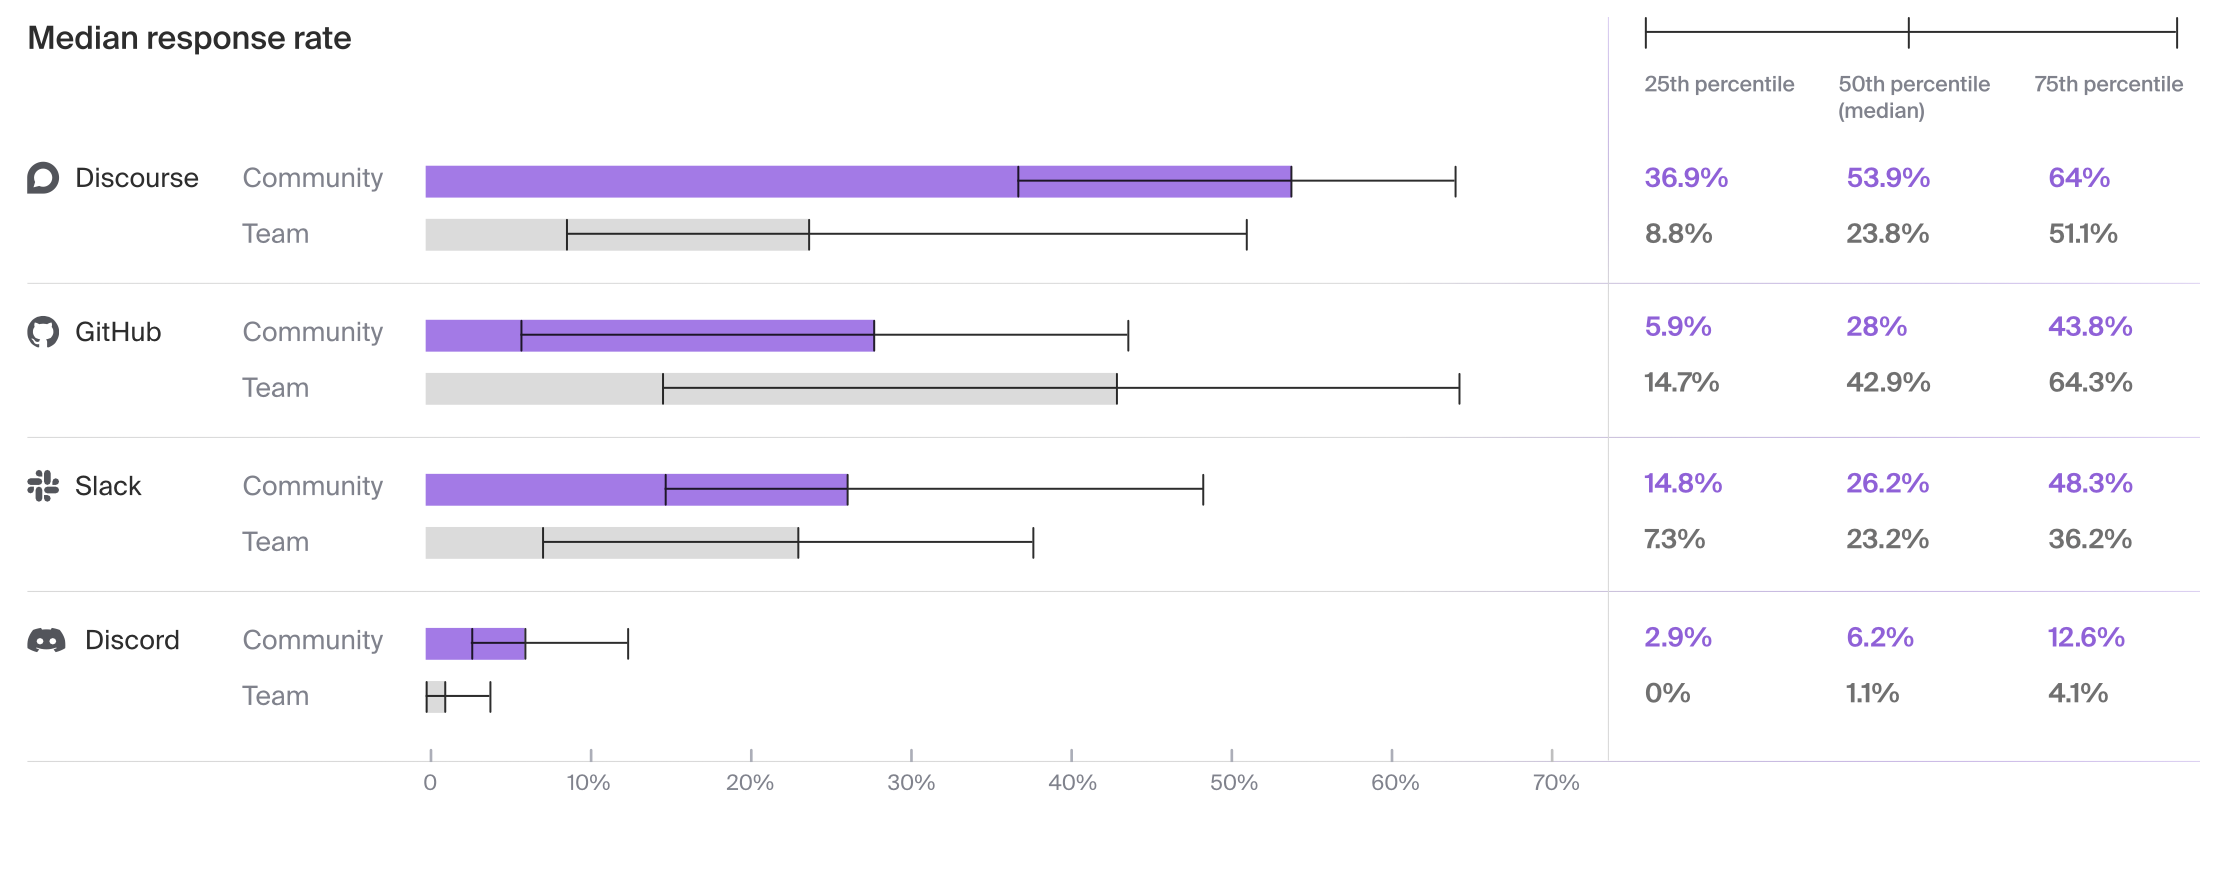
5. Communities are collaborative, generative, and helpful—and community responsiveness shows it. Excluding GitHub, community response rates are significantly higher than team response rates, which underpins an important relationship between community and user success. Discourse has the highest response rate from community members and GitHub has the highest response rate from internal teams. Discord has the lowest response rate from both community members and internal teams.
This is the beginning
Ultimately, this initial report sets the stage for more data collection and analysis in the future. Communities, and the organizations and teams that serve them, will continue to grow, change, and shape new insights and actions. At Common Room, we’ll continue to do everything we can to support the success of communities and the work of community teams as both evolve, and we’re excited to evolve and elevate the profession with you.
📈
For more, read the full report.
To better engage, grow, and support your community, get started with Common Room for free. To connect with 1500+ community and DevRel leaders, join our Uncommon community Slack.
We think you'd like these
How we seeded our future champions program using Common Room
Feb 8th, 2023·8min readCommunity
Guide to community operations
Jan 17th, 2023·10min readCommunity
The 2022 Developer Relations Compensation Report
Jul 28th, 2022·3min readCommunity
Pricing for everyone: introducing simplified pricing for every go-to-market team
Apr 23rd, 2024·4min readCommunityProduct