Your ideal customer is a 250-person SaaS company using Salesforce, headquartered in Austin. You know their industry, their size, their revenue range. You even know their tech stack. And your reps are still missing quota.
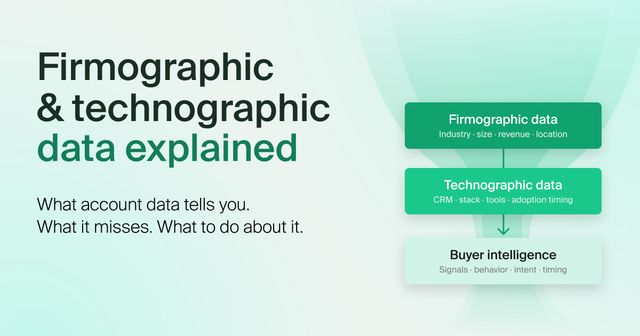
The data that describes what a company is and how it operates is valuable. But it tells you nothing about whether that company is actually ready to buy. Firmographic and technographic data are the foundation of any good GTM strategy. The mistake is treating them like the whole picture.
Fit tells you which companies could buy. It tells you nothing about which ones are ready to.
This guide covers what firmographic and technographic data actually are, how sales and marketing teams use them, where they fall short, and what to layer in when they do.
What is firmographic data?
Firmographic data is the B2B equivalent of demographic data. Where demographics describe individual people, firmographic data describes companies: their characteristics, structure, and market position.
Think of it as the profile of a business. If you were describing a person, you'd include age, location, and job. If you're describing a company, you include:
- Industry vertical
- Company size (employee headcount)
- Annual revenue
- Geographic location
- Funding stage and ownership type
- Growth indicators (headcount trends, recent funding rounds, M&A activity)
Sales and marketing teams use this data to answer one foundational question: which companies should we even be talking to? Firmographic segmentation lets you build an ideal customer profile (ICP), prioritize accounts by fit, and stop wasting effort on prospects that will never convert.
A company with $500M in annual revenue buys very differently from one with $5M. A VC-backed startup moves faster than a public enterprise with procurement committees. These attributes shape buying behavior, and firmographic data surfaces them at scale.
What is the difference between demographic data and firmographic data?
Demographic data describes individual people: age, income, job title, location. Firmographic data describes the companies those people work for: size, industry, revenue, structure.
In B2B, you need both. Firmographics help you identify the right companies to target. Demographics help you find the right contacts within those companies.
Examples of firmographic data in practice
What does firmographic research actually look like? Here are common examples of how sales teams use it:
- Filtering your CRM to companies with 100–500 employees in financial services, a segment you know converts at twice the rate of others
- Identifying Series B companies in your territory that just raised funding (growth indicator = likely to invest in new tools)
- Building ABM lists of enterprise accounts based on company size and industry before layering in intent data
- Routing inbound leads based on revenue tier to match reps with accounts they're equipped to close
What is technographic data?
Technographic data is information about the technology stack a company uses: the software applications, tools, and platforms that power their operations.
Where firmographic data tells you what a company is, technographic data tells you how it operates. Two companies can look identical on firmographics and be in completely different situations depending on whether one is running legacy CRM software and the other just rolled out a modern GTM stack.
For sales teams, technographic data answers some of the most important qualification questions:
- Does this company already use a competing solution?
- Is there a gap in their stack your product fills?
- Are they running infrastructure that integrates with what you sell?
- Did they just add or remove a tool that signals a shift in priorities?
Examples of technographic data
A technographic data provider typically collects information across categories like:
- CRM platforms (Salesforce, HubSpot, Microsoft Dynamics)
- Marketing automation tools (Marketo, Pardot, HubSpot Marketing)
- Sales engagement tools (Outreach, Salesloft, Apollo)
- Data infrastructure (Snowflake, Databricks, BigQuery)
- Cloud infrastructure (AWS, Azure, GCP)
- Communication tools (Slack, Zoom, Microsoft Teams)
Beyond what tools a company uses, the most useful technographic data includes when they adopted them and when contracts are likely to renew, because companies actively evaluating alternatives are the highest-value targets for competitive displacement plays.
How do you collect technographic data?
Marketing and sales teams don't typically have direct visibility into what software their prospects run. The main ways to collect technographic data are:
- Website scanning: detecting technologies visible in the front-end code
- Job posting analysis: companies hiring for specific platforms signal investment in those tools
- API integrations and partnership data
- Third-party providers that aggregate data from multiple collection methods
Each method has tradeoffs. Website scanning gives real-time signals but misses internal systems. Job postings reveal intent but not current deployment. For most marketing and sales efforts, using a reliable technographic data provider that combines multiple sources is the most scalable approach.
How to use firmographic and technographic data together
Used in isolation, each data type has real limits. Together, they dramatically sharpen targeting.
The right sequence is: firmographic first, technographic second.
Firmographics define your addressable market. They answer: which companies are the right size, in the right industry, with the right buying power to be a realistic customer?
Technographics narrow that pool further, revealing which of those companies have the operational context to need and use what you sell.
A practical example from marketing and sales strategy:
- Tier 1 accounts: Mid-market SaaS companies (200–1,000 employees) using Salesforce but lacking a sales engagement tool, a clear gap your product fills
- Tier 2 accounts: Enterprise financial services firms with 1,000+ employees using HubSpot and actively adding headcount in sales
- Tier 3: Professional services firms with 50–200 employees, any CRM, major metro areas
That kind of segmentation gets your reps in front of potential customers who actually have the budget, infrastructure, and need (not just companies that happen to match a few filters).
Using both to define your ICP
Marketing and sales teams that build their ICP from firmographic and technographic data together produce more accurate targeting criteria. The process is straightforward:
- Pull your top 20 customers by retention or revenue
- Identify common firmographic attributes: company size, industry, revenue band, ownership type
- Identify technology overlap: which CRMs do they use, what's in their sales stack, what data infrastructure are they running
- Document attributes appearing in 60% or more of your best accounts
- Build those criteria into your scoring model and account prioritization
This turns your ICP from an educated guess into a pattern you've validated against closed-won data.
Where firmographic and technographic data fall short
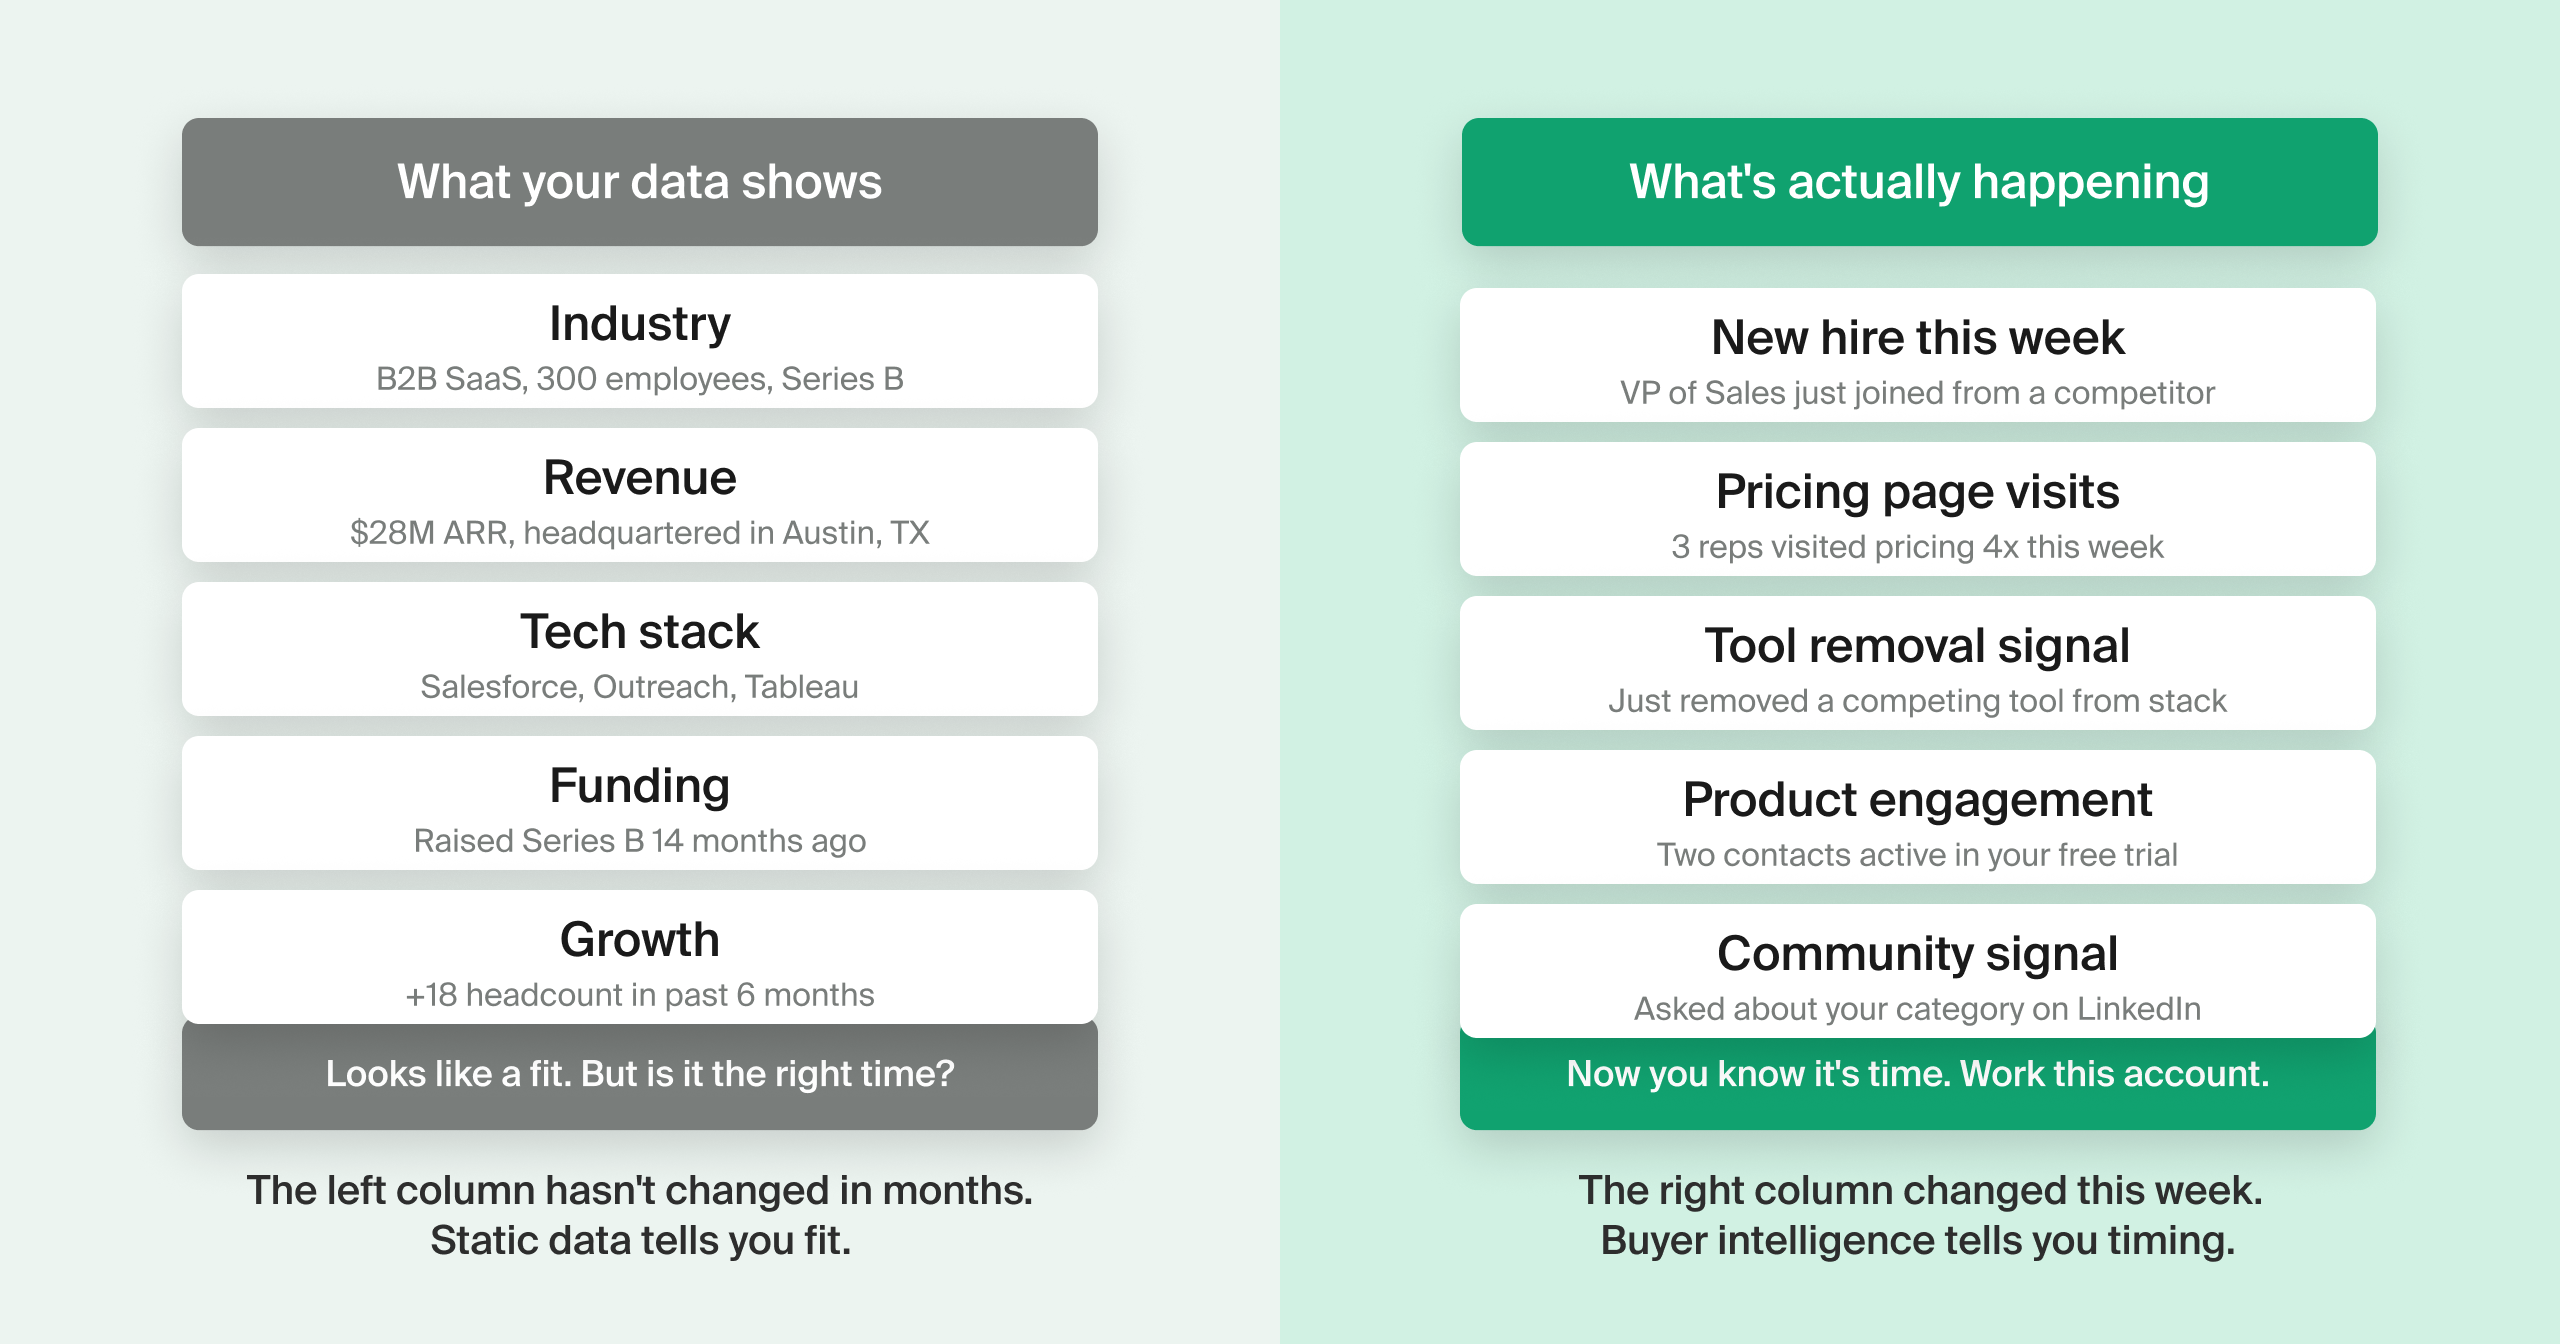
Firmographic and technographic data tell you a company is a fit. They don't tell you it's a fit now.
A company can match your ICP on every dimension—right size, right industry, right tech stack—and still be completely wrong to call this week. Budget frozen. New CTO just started. Competing initiative killing the timeline.
Static account attributes don't capture:
- Which stakeholders are actively researching your category
- Whether anyone from the account has engaged with your content or visited your website
- What's changing inside the account — new hires, product launches, funding events
- Signals that indicate the account is in an active evaluation cycle
The additional layer you need: buyer intelligence
Firmographic and technographic data establish account fit. Buyer intelligence tells you who's ready to engage, and why.
Buyer intelligence layers behavioral signals on top of account attributes: who's visiting your site, who's engaging with your content, who just joined the account in a role that signals a buying cycle, what conversations are happening in your product.
That's the layer most teams are missing, and it's why firmographic and technographic data alone keep producing lists that look right but don't convert. Common Room unifies first-party data from your CRM, product, and marketing systems with real-world buyer signals (web activity, job changes, community engagement, dark funnel signals) and connects them to real people and accounts through AI-powered identity resolution.
The result is a continuously updated view of your buyers that goes well beyond what any single data type can surface.
How marketing and sales teams use Common Room
For sales teams, Common Room surfaces which accounts are showing real buying signals right now, not which accounts look good on paper. Your reps can see:
- Which contacts at a target account have been active on your site or in your product
- New hires in buying roles at accounts already in your pipeline
- Accounts spiking in product usage, signaling expansion opportunity
- Dark funnel activity — people researching your category before they ever fill out a form
For marketing teams, Common Room's enrichment keeps your CRM accurate with company data that refreshes automatically, so your firmographic filters are working from accurate data — not stale records that decay the moment your last enrichment run finished.
And for RevOps, it's all one system — no stitching together a firmographic data provider, a technographic data provider, and a separate intent platform to get a picture that should exist in one place.
The bottom line
Firmographic and technographic data are table stakes. Every serious sales and marketing team uses them. The teams that win aren't the ones with better firmographic filters — they're the ones that layer actual buying behavior on top.
Know what a company is. Know how it operates. Then find out who's actually ready to buy. Your reps are already working accounts that match your ICP. The question is whether they're working the ones that are actually in market.