About six months ago, I shared why I joined Common Room. TL;DR: I’ve personally felt the impact and value of community, and I was excited at the opportunity to help organizations understand, nurture, and grow impactful communities of their own.
Over the past few months, our small but mighty data team has been solving a bunch of interesting problems across the organization—from establishing metrics to measure the success of our general availability launch to A/B testing elements of our onboarding experience to building artificial intelligence into new features that help our customers better understand their members and communities.
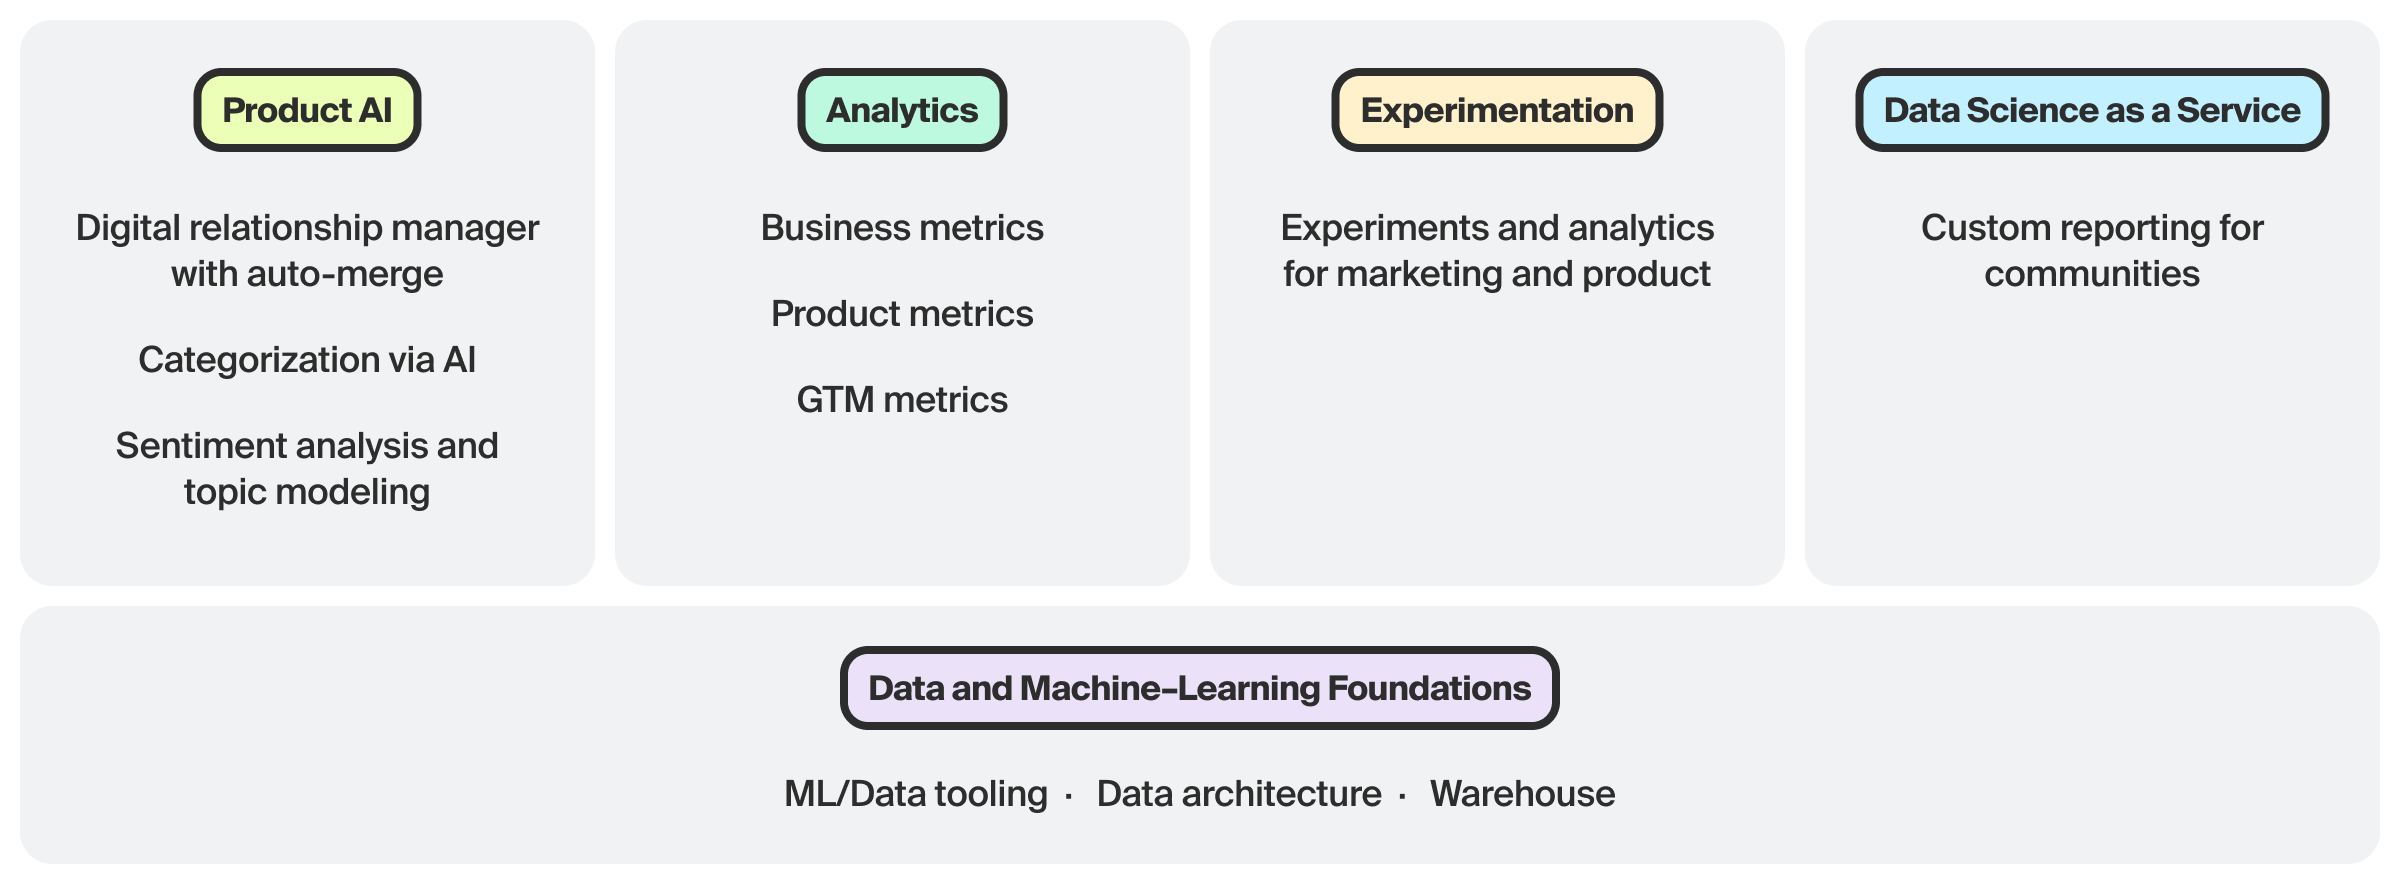
There are so many problems to be curious about, especially at a smaller, high-growth company, so it becomes critical to pick the right problems that are most relevant to an organization and double down on those. To help us choose the right problems to solve, we identified five key areas (four pillars and one foundational workstream) for our data science organization that guide the work we do:
- Product artificial intelligence (AI)
- Analytics and metrics
- Experimentation
- Data Science as a Service (DSaaS)
- Data and machine learning (ML) foundations
Product AI
Common Room is an intelligent community growth platform. We bring together community conversations and engagement across various community channels and add a layer of intelligence on top so that conversations, questions, trends, content, feedback, and sentiment from the community can be quickly surfaced, understood, and acted upon. In the product, we apply artificial intelligence techniques to benefit our customers in the below areas:
Auto-merge
We create a unified view of our customers’ community members from the most popular channels and sources that people engage with today. Our native integrations include Slack, Discourse, Twitter, Discord, GitHub, Stack Overflow, LinkedIn, Meetup, YouTube, CRMs like Salesforce and HubSpot, engagement and support systems like Intercom, and more. Each integration offers different features with different types of data, like member information, community activity, and customer details. With auto-merge, Common Room uses machine learning to detect if two (or more) community member profiles are the same person and combines them, giving our customers a digital relationship manager with a single, enriched view of each member across different sources.
Categorization
Community conversations cover all kinds of different subjects—everything from sharing product appreciation to making feature requests, asking support questions to sharing helpful content, and more. Common Room uses AI to classify conversations into categories such as product appreciation, bugs, feature request, account support, and more. These help communities identify, understand, and take action on the types of conversations going on across their channels, and quickly direct those conversations to the right internal teams for resolution, like sharing support questions with customer success or product bugs and feature requests with the product team.
Sentiment and topics
A critical insight for any organization is to understand sentiment across their community. When sentiment is known, community leaders and companies can take specific action. Common Room’s sentiment analysis allows community leaders to quickly search for and find positive or negative comments across the community, so you can do things like share positive feedback of features with the product team or provide support by finding and addressing members’ individual challenges.
Another important aspect of community conversations is understanding what is being talked about. Common Room intelligently detects topics by using AI-powered natural language processing to distill what’s happening in a community into a digestible format. This enables community leaders to easily and accurately understand what matters most to their community in real time. Using insights from topic trends, sentiment, and reporting, community leaders can inform and influence broader initiatives, like product development, event organization, and content creation.
Combining sentiment and topics provides powerful insight. For example, a developer advocate would be able to see if negative sentiment emerged around a new release—perhaps it broke existing functionality—and Common Room’s sentiment analysis would surface this as a trending topic in the community, and teams could take action right away.
Analytics
In addition to the benefits our customers see in the Common Room product, analytics are critical for monitoring the health of our offering and business. The data team divides the work done in this pillar into three main categories: key business metrics, product metrics, and GTM metrics.
While preparing to make Common Room generally available (GA), we implemented a single dashboard containing key performance indicators for our business. Key business metrics we monitor include DAU and WAUs (daily and weekly active users, respectively), the number of communities on our platform and the number integrations they use, user stickiness (a ratio of DAU/MAU), and more. This provided our leadership team with easy access to quantitative data to know if we were on track for hitting our goals for GA and the ability to make data-driven decisions for the upcoming quarters.
We then shifted to focus on measuring our existing and upcoming product releases, including workflows, impact points, topics + sentiment, to define their utility metrics. Utility metrics allow us to see if and how features are being used so we can make our product even better for our customers. Some examples of utility metrics are: the number of times a particular feature is used, the number and length of sessions, and the number of times an automated feature is triggered.
The last key category under analytics is providing the data foundations and metrics to our go-to-market teams to enable data-led growth (e.g. sales funnel metrics).
Experimentation (A/B testing)
Experimentation, or A/B testing, is well understood to be critical for rapid deployment and innovation for any product. To move fast, you have to rapidly release new changes, while also being able to measure how these new changes land with customers. Given our relatively recent GA, we expect many of our experiments and changes to not yet be statistically significant, but we can still use this testing to provide directional information and guidance.
In theory, anything can be tested, from the color and size of a button in the app to a new product onboarding experience. The results of even small changes can be surprising! To stay focused in our small but mighty team, we currently focus our experimental analysis on customer emails and key product changes that we make.
Data Science as a Service
The communities we serve through our customers are widely varied—from fanatic product design and collaboration tool communities to deeply technical communities discussing data and observability tools to massive and semi-anonymous web3 communities, they all have different sizes, shapes, and needs.
All our customers benefit from the data, analytics, and AI built into our features and reporting, as you read about in the product AI pillar. Some communities want to take this a step further with advanced reporting that digs deeper. As part of our Data Science as a Service pillar, we partner one-on-one with a customer to further examine community impact on the organization, like how how community contributes to their marketing and sales pipelines, the impact of community engagement on product adoption, or the impact of their community champions on user retention and success, product adoption, and more. We provide these analyses as a premium service to the communities on our platform.
Data and ML foundations
Last but fundamentally important to all our pillars, our data and ML foundations workstream is the bedrock for all of our other work. As the name suggests, we consider it the foundation on which the entirety of our data science and AI work is built.
Many case studies and research [1, 2] show that most data scientists still spend the lion’s share of their time preparing data for analytics and modeling and only about 25% of their time actually building models and deriving insights. We want data to be accessible in a reproducible, less tedious way so we can spend as much time as possible delivering insights through our other pillars. To achieve this, we continuously evaluate whether we have the right tools to help us be efficient and accurate, especially as our data needs evolve through our company and product growth. This includes tooling for data warehousing, data visualization, and ML.
Building stronger communities with data
At Common Room, we firmly believe that data is one of the critical components that will continue to unlock our platform’s truest potential for our customers and the communities they build, grow, and support. Our multi-pronged approach towards using data and AI ensures that we'll continue to grow with increasing efficiency and be able to offer even more useful and powerful insights to community and company leaders, and the members they serve.
Thank you to our amazing data and engineering team for identifying and embodying these five pillars to drive business impact for our customers: Josh Bricel, Kaushik Barat, Kirill Sapchuk, Lena Vasileva, Tom Kleinpeter, and Viraj Mody!
Want to see the data team’s work in action? Request a demo or request a demo to learn how to make your community a strategic advantage.