
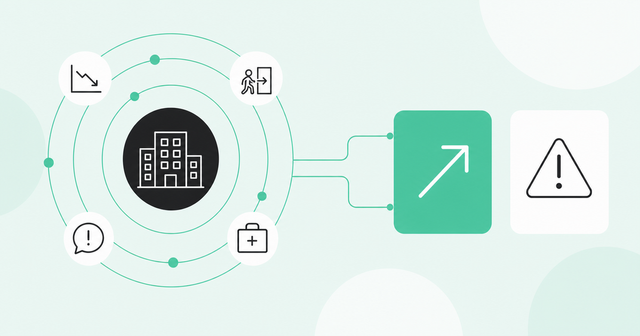
Most renewal surprises aren't really surprises. The warning signs showed up months earlier, just spread across five systems that nobody checked at the same time.
This guide shows you how to spot expansion and churn risk in SaaS accounts before the renewal date does it for you. You'll learn which signals to watch, how to combine them into one view, and what to do when one shows up.
How Do You Spot Expansion and Churn Risk Early?
You spot expansion and churn risk early by watching leading indicators: usage trends, champion changes, support patterns, engagement, and hiring. Pull those signals from your CRM, product, and outside sources into one account health view. Then give every signal a play and an owner, so someone actually acts on it.
A leading indicator is a signal that changes before the outcome you care about. A lagging indicator, like a cancellation notice, only confirms what already happened. By the time a lagging indicator arrives, your options shrink to a discount and an apology.
Churn is when a customer cancels, doesn't renew, or downgrades, and you lose that revenue. Expansion revenue is the extra money existing customers add through more seats, upgrades, or add-ons. Both start as small changes inside an account long before they show up in the forecast.
Annual recurring revenue (ARR) is the yearly value of your subscription contracts. Gross revenue retention (GRR) is the share of last year's ARR you kept from existing customers, not counting upsells. Both numbers tell you how well your SaaS account management is working.
The stakes are getting higher. In Benchmarkit's 2026 B2B SaaS metrics report, expansion made up a median 40% of net new ARR, while median GRR fell from 88% to 84%. So existing customers drive a big share of growth, and keeping them is getting harder.
Expansion is also the cheaper way to grow. A CAC ratio is how much you spend on sales and marketing to add $1 of new ARR. Benchmarkit's 2025 SaaS benchmarks put the median expansion CAC ratio at $1.00, versus $2.00 for new customers.
Both Benchmarkit figures come from self-selected surveys of private B2B SaaS companies. Treat them as useful medians, not universal laws.
Leading Indicators of Churn
Churn rarely arrives without warning. The warning just arrives somewhere nobody's looking.
Each indicator below comes with what to watch and what's easy to miss.
Usage Decline
Usage decline means fewer people use your product, use it less often, or use fewer parts of it. Watch for falling weekly active users, abandoned features, and shorter, shallower sessions.
Compare each account to its own baseline, not a global average. A 200-person account that drops to 120 active users is in trouble, even if 120 beats your average customer.
Be wary of health scores built on log-ins alone. A log-in tells you someone opened the app, not that they got value. An account can log in every day and still churn because the workflow it bought you for never stuck.
- What to watch: Track the four-week trend in active users and core-feature use against the account's own 90-day baseline.
- Easy to miss: A steady log-in count can hide a team that quietly stopped using the features tied to its renewal goals.
Champion Departure
A champion is the person inside the account who bought you, defends you, and explains your value to their boss. When that person leaves, your renewal loses its loudest supporter.
In research reported by ChurnZero in 2023, Sturdy found a 51% chance that an account churns within 12 months after its champion leaves. It's an older, vendor-reported figure with no published method, so treat it as a useful hint rather than a rule.
Watch executive sponsors and reorgs too. An executive sponsor is the senior leader who owns the budget, and a reorg can hand your product to a team that never chose it. Too many teams find out about customer champion job changes when an email bounces, which is far too late.
- What to watch: Monitor job changes, title changes, and reporting-line changes for your champion, executive sponsor, and top users.
- Easy to miss: A champion who gets promoted stays at the company but may stop using your product day to day.
Support Escalations
Support data shows where customers feel friction. Watch for rising ticket volume, the same issue coming back, escalations to executives, and a sharper tone in tickets.
Silence can be a signal, too. An account that used to file tickets and suddenly stops may not be happy. It may have stopped trying.
- What to watch: Look for repeat tickets on one issue, any executive escalation, and sentiment that shifts from neutral to frustrated.
- Easy to miss: A drop in tickets from a once-active account can mean the team gave up rather than solved its problems.
Low Engagement
Engagement is how often people at the account show up and respond. Missed quarterly business reviews (QBRs), unanswered emails, and no-shows at webinars or community events all point the same way.
Pay close attention to the buying committee, the group of people who influence the purchase and the renewal. When that group shrinks from six people to one, your renewal rests on a single inbox. Activity outside your product counts, too, like whether the team still comments on your posts or asks questions in your community.
- What to watch: Count how many distinct people at the account engaged this month compared with last quarter.
- Easy to miss: One very active contact can make a disengaged account look healthy.
Leading Indicators of Expansion
Expansion signals look like a customer outgrowing its current contract. The goal is to see them before the customer has to ask or, worse, starts shopping around.
Many of these are the same product-led buying signals sales teams use with free users. The difference is that you already have a relationship to build on.
New Teams Adopting
New teams show up in quiet ways. A new department starts a workspace, a new email domain signs up, or a business unit in another region invites colleagues.
The tricky part is connecting those new users to the right account. Someone signing up with a subsidiary's email domain can look like a brand-new lead instead of growth inside an existing customer. A sudden surge in product log-ins from one company is often the first clue.
- What to watch: Look for new domains, departments, or workspaces tied to an existing customer, plus spikes in new users.
- Easy to miss: Users from an acquired company or subsidiary often sign up under a different domain than the parent account.
Hiring
Job postings tell you where a company plans to grow. If a customer posts a dozen openings for the roles that use your product, that's a seat forecast hiding on a careers page.
Headcount growth in the teams you serve works the same way. More people doing the job usually means more people who need the tool.
- What to watch: Track open roles and headcount growth in the departments that use your product.
- Easy to miss: Hiring for a new team lead often comes before a wave of new hires on that team.
Usage Near Limits
Some customers will tell you they need more by bumping into their plan. Watch seats, API calls, storage, and other caps as accounts get close to the edge.
Attempts to use premium features count, too. Reach out before the customer hits the wall, because nobody wants an overage invoice to be the first expansion conversation.
- What to watch: Flag accounts above 80% of any plan limit and anyone who clicks into a locked feature.
- Easy to miss: A team that stops adding users because it's at its seat cap can look like a team that stopped growing.
New Stakeholders
New people bring new budgets. A new executive, a new team lead, or new visitors reading your pricing and advanced feature pages can all point to a bigger deal.
The best version is a former champion who joins a new company. Job changes work both ways: They create risk at the old account and an opening at the new one. You can handle both by tracking job changes automatically, instead of refreshing LinkedIn all day.
- What to watch: Watch for new leaders at existing accounts and former champions who land at companies that fit your ideal customer profile.
- Easy to miss: A new executive at a healthy account may bring a preferred vendor from a past job.
Building an Account Health View from CRM, Product, and Engagement Data
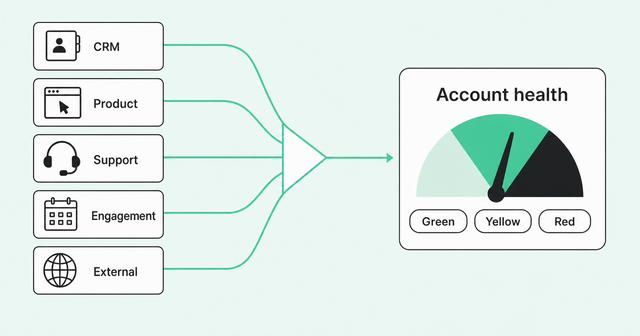
A health score is one number or color that sums up how an account is doing. It only works if it pulls from every place the account leaves clues.
Here's what each source tells you.
| Data source | What it reveals | Example signal |
|---|---|---|
CRM | Contract value, renewal date, owner, and open deals | Renewal in 75 days with no meeting booked |
Product usage | How deeply and how often the account uses you | Active users down four weeks in a row |
Support | Friction, bugs, and customer sentiment | Third escalation on the same issue |
Engagement | Relationship strength across email, meetings, and events | Champion skipped the last two QBRs |
External signals | Changes you can't see in your own tools, like job changes and hiring | Champion's profile lists a new employer |
Start simple. Give each area a weight, add them up to 100 points, and set three bands. For example, green is 70 or higher, yellow is 40-69, and red is below 40.
A starting mix might weight usage at 40%, stakeholders at 25%, support at 20%, and engagement at 15%. These aren't magic numbers. They're a first draft you'll adjust once you see which accounts actually churn.
Track direction every week, not just the score. An account sliding from 85 to 72 in a month needs more attention than one that's been sitting at 65 all year.
Your health scores should roll up to two portfolio numbers. Net revenue retention (NRR) is the share of last year's ARR you have today, counting expansion and subtracting downgrades and churn. GRR leaves expansion out, so it can never go above 100%.
In SaaS Capital's 2025 retention benchmarks, median NRR was 101% and median GRR was 91% across more than 1,000 private B2B SaaS companies. That 91% differs from Benchmarkit's 84%, and the two surveys use different samples and definitions.
Here's the hard part: The data lives in different tools, and none of them agree on who's who. We built Common Room around unifying signals across sources, so CRM records, product usage, and job changes tie back to the same people and accounts.
Its explainable AI scoring keeps scores explainable at the person level and rolls them up to accounts. Teams see both the priority and the story behind it, so nobody has to reverse-engineer a number before a meeting.
One question comes up often in our customer conversations with CSMs and AMs: "How do we use this for expansion, not just new logo acquisition?" Tracking job changes for champions and former customers is a use case that keeps coming up in those conversations. If you're comparing tools, our guide to choosing a SaaS account management platform covers what to look for.
Turning Signals into Plays for AMs
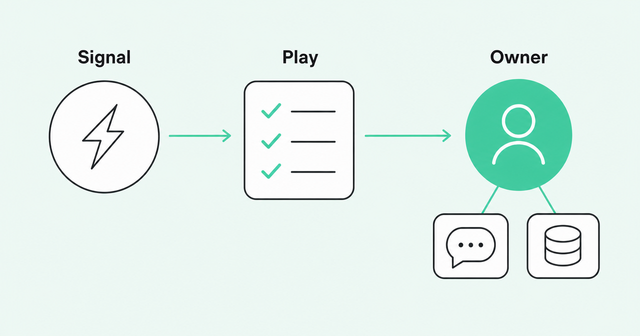
A signal nobody owns is just trivia. A play is the agreed response to a signal: who does what, and how fast.
Map every signal to a play and an owner before the signal ever shows up. Here's a starting point.
| Signal | Play | Owner |
|---|---|---|
Active users down four weeks in a row | Book a value check-in, revisit goals, and fix the adoption gap | CSM |
Champion leaves | Meet the replacement within two weeks and reconnect with the champion at the new company | AM |
Executive sponsor change or reorg | Set up an exec-to-exec intro and refresh the business case | Exec sponsor |
Repeat escalations on one issue | Run a root-cause review and share a fix plan with dates | Support lead |
Missed QBRs and unanswered emails | Switch channels and build relationships with other users | AM |
New team adopting | Offer onboarding to the new team and scope a broader plan | AM |
Hiring for roles that use your product | Share a seat plan ahead of the new hires | AM |
Usage near plan limits | Start the upgrade conversation before the overage | AM |
Former champion joins a new company | Send a personal note and offer a short intro call | AM |
Scores that don't match outcomes | Audit inputs and weights every quarter | RevOps |
The table only works if signals reach the owner where they already work. Route alerts into the CRM record and the team's Slack channel, not a dashboard nobody opens. Common Room's RoomieAI helps turn insight into action from the tools your team already works in, but a person still owns the call.
A few rules keep plays from turning into noise:
- One owner per play: Shared ownership usually means nobody follows up.
- Clear time limits: "Within two weeks" beats "soon" every time.
- Stacked signals first: A champion exit plus falling usage outranks either signal alone.
Done well, the same system that protects renewals also keeps you growing customer lifetime value year after year. Risk plays and expansion plays run on the same data.
Reviewing Risk in Account Reviews
Signals and plays need a rhythm. A weekly 30-minute at-risk review keeps the whole team looking at the same accounts.
Use the same four-part agenda every week:
- Portfolio direction: Accounts that moved up or down a color since last week
- At-risk list: Every red account, its top signal, and the play in motion
- Upcoming renewals: Every account renewing in the next 60-90 days, whatever its color
- Expansion pipeline: Accounts showing growth signals and the next step for each
Talk about what changed, not what's the same. "Acme is still yellow" wastes everyone's time, while "Acme lost its champion Tuesday" gives the room something to act on.
Close the loop after every play. Record what you did and what happened, then check each quarter whether red accounts actually churned and green ones renewed.
If your scores keep missing, change the weights. That's the cycle: Know what's happening, act on it, and learn from the result.
FAQ
What's the Difference Between NRR and GRR?
NRR counts the revenue you keep from existing customers plus any expansion, so it can top 100%. GRR counts only what you keep after churn and downgrades, so it maxes out at 100%.
What's the Difference Between Voluntary and Involuntary Churn?
Voluntary churn is when a customer chooses to leave, and involuntary churn is when a payment fails and the subscription lapses. In Recurly's churn rate benchmarks, SaaS voluntary churn was 2.16% versus 1.06% for involuntary churn across its billing network.
How Do You Calculate Churn Rate?
Divide the customers you lost during a period by the customers you had at the start, then multiply by 100. For revenue churn, use ARR lost instead of customer counts.
How Often Should You Review At-Risk Accounts?
Review at-risk accounts weekly, and track health score direction at the same pace. Monthly reviews tend to catch problems after the best window to act has closed.
What Features Matter Most in a Post-Sale Account Management Platform?
Look for one view that combines CRM, product, support, and external signals at the person and account level. It should also explain why scores change and route each signal to the right owner.
What Are Common Health Score Mistakes?
The big ones are scoring on log-ins alone, comparing accounts to a global average, and never checking scores against real renewals. Overbuilt models with dozens of inputs are a close fourth, because nobody trusts what they can't explain.
Start with the Signals You Already Have
You don't need a perfect model to start. Pick five signals, give each one a play and an owner, and review them every week.
The accounts that churn and the accounts that grow both leave clues early. Want to see how Common Room connects those clues to the right people and accounts?