
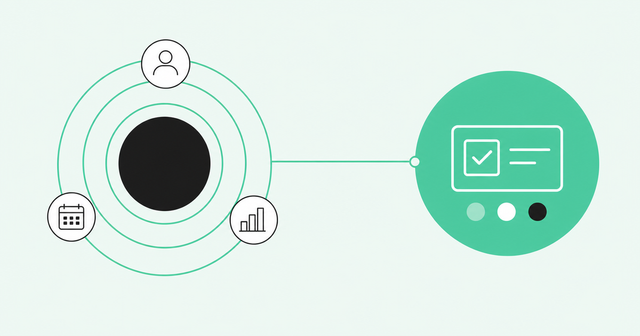
Your rep is at 60% of quota with three weeks left. The quota report says so. The pipeline report shows three deals stuck in one stage for a month. Nobody connects the two until the forecast call, when the rep says "I feel good about it."
That gap is why so many teams ask how to measure rep performance and deal health in one analytics dashboard. This guide walks through five steps, two metric tables, and a sample layout you can build this week.
Why Rep Metrics and Deal Metrics Belong Together
To measure rep performance and deal health in one analytics dashboard, pick four to six rep metrics, such as activity, conversion, and cycle length. Add four deal health indicators: stakeholder coverage, engagement recency, stage age, and a confirmed next step. Then connect CRM and activity data, and link every rep's forecast number to the deals behind it.
A sales dashboard is a single screen that shows your key sales metrics, pulled from your CRM and sales tools. Most teams build two of them: a sales performance dashboard for reps and a pipeline report for deals. The trouble is that each one only tells half the story.
Quota attainment tells you what happened. Deal health tells you why. Deal health means how likely an open deal is to close on time, based on what the buyer is doing, not what the rep hopes.
When the two live in separate reports, managers fill the gap with rep self-reporting. When they live in one view, you can click on a rep's number and see the exact deals holding it up.
There's one more rule: the dashboard can't create more admin work. According to Salesforce's 2026 State of Sales research, "While the average seller spends 40% of their time selling, Gen Z reps are trapped at just 35% — losing approximately two full hours each week to manual data entry [...]." If your dashboard needs reps to type in more fields, it's making that problem worse.
Step 1: Pick Rep Performance Metrics
Rep performance metrics explain how someone sells. They show whether a rep is talking to buyers, moving deals forward, and closing at a healthy pace.
Keep the list to four to six metrics. Every extra metric is one more thing a manager has to explain in the review, and most of them won't change a single coaching conversation.
Use these guidelines when you choose:
- Count conversations, not clicks: Track meetings held, not emails sent. More activity doesn't equal more pipeline.
- Weight conversion over volume: A rep who books fewer meetings but converts more of them is often doing better work.
- Mix leading and lagging indicators: Leading indicators predict future results. Lagging indicators, like quota attainment, report results that already happened.
- Compare to the team median: The median is the middle value when you line up every rep. It shows what's normal on your team, not just what's on the plan.
Rep Metric Definitions Table
Here's a starter set of sales dashboard KPIs, with what each one measures and what a weak result usually means for coaching.
| Metric | What It Measures | What a Weak Result Usually Means for Coaching |
|---|---|---|
Meetings held | Live conversations with buyers each week | The rep may be stuck in email; practice asking for time on the calendar |
Stage-to-stage conversion | Share of deals that move from one stage to the next | Discovery or qualification breaks down at a specific stage |
Win rate | Share of qualified deals that close as won | The rep may be advancing poor-fit deals or losing late on value |
Sales cycle length | Average days from opportunity creation to close | Deals stall without a dated next step or a shared plan with the buyer |
Quota attainment | Closed revenue as a share of quota | A lagging result; check the rows above to find the cause |
Pipeline created | Value of new qualified pipeline added in the period | The rep needs help with prospecting or account focus |
Read the table from the top down. If quota attainment is low, the earlier rows usually point to where the problem starts.
Comparing each rep to the team median keeps your sales dashboard fair. A rep at 70% of quota is ahead on a team with a 65% median. The same rep needs real coaching on a team with a 95% median.
Step 2: Define Deal Health Indicators
Deal health indicators explain what's real in the pipeline. They look at the buyer's side of the deal instead of the rep's confidence.
Use four indicators to keep the scoring simple:
- Stakeholder coverage: How many people on the buyer's side are involved, and from how many departments.
- Engagement recency: How recently the buyer took an action, like replying, joining a call, or visiting your site.
- Stage age: How long the deal has sat in its current stage compared to your typical deal.
- Confirmed next step: Whether the buyer has agreed to a dated next meeting or action.
Stakeholder coverage matters more than most teams expect. Forrester's State of Business Buying found that "On average, 13 people within an organization are involved in the buying decision, with 89% of purchases involving two or more departments." A deal with one friendly contact is a single thread, and single threads break easily.
Engagement recency should measure what the buyer does, not what the rep logs. A rep can send 10 emails in a week, but if nobody on the buyer's side replies, the deal isn't getting warmer.
This is where Common Room can help you map the full buying committee. Per our buying committee documentation, the view labels each person on an account Engaged, Warm, or Not engaged, using a 30-day lookback by default. It also shows coverage gaps, so you can see which roles nobody has reached yet.
Next, give each indicator simple green, yellow, and red thresholds. The table below shows example thresholds a team might start with. These aren't industry benchmarks, so adjust them to match your own sales cycle.
| Indicator | Green (Example) | Yellow (Example) | Red (Example) |
|---|---|---|---|
Stakeholder coverage | Three or more engaged contacts in two or more departments | Two engaged contacts in one department | One engaged contact or none |
Engagement recency | Buyer engaged in the last 14 days | Last buyer engagement was 15-30 days ago | No buyer engagement in more than 30 days |
Stage age | At or below your typical time in stage | Up to 50% longer than typical | More than 50% longer than typical |
Confirmed next step | Dated next step the buyer agreed to | Next step logged, but no date or buyer confirmation | No next step logged |
A deal with two or more red indicators belongs on the review agenda. Your team decides the exact rule, then sticks to it so every rep gets scored the same way.
Step 3: Connect CRM and Activity Data
A dashboard is only as good as the data behind it. If rep metrics and deal metrics come from different sources that don't match, your one view will show two different stories.
Most teams pull from three sources:
- CRM records: Stage, amount, close date, and owner for every opportunity.
- Activity and engagement data: Emails, meetings, and calls between reps and buyers.
- Buyer signals: Website visits, product usage, and other actions buyers take on their own.
The hidden step is identity resolution. Identity resolution means matching each email, meeting, or website visit to the right person and the right account. Without it, a call with a buyer's personal email address never shows up on the deal, and your engagement recency score is wrong.
Before you build anything, clean up duplicates and stale records. Use a CRM data hygiene checklist to find duplicate contacts, old close dates, and deals with no owner.
Top teams already treat this as a priority. Salesforce's State of Sales research found that among high performers, "79% prioritize data hygiene compared with only 54% of underperformers."
Step 4: Build Drill-Downs From Forecast Number to Deals
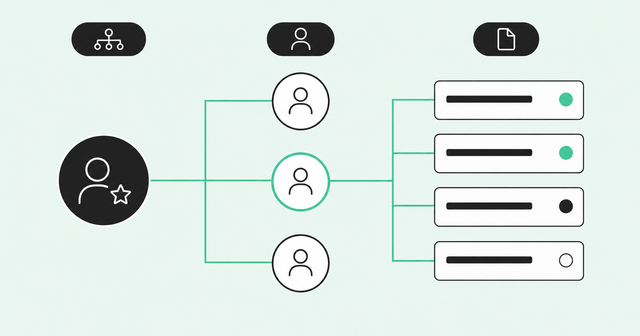
This step answers a question managers ask before every pipeline review: can I see the specific deals behind a rep's forecast number? Yes, if your dashboard rolls up the forecast by rep and lets you click into each number.
A drill-down is a link from a summary number to the records that make it up. Here, each rep's forecast cell should open a deal list with the health indicators from Step 2 right next to each deal.
Most teams group the forecast into forecast categories. These are labels that show how confident a rep is that each deal will close this period:
- Commit: Deals the rep expects to close this period and would stake the forecast on.
- Best case: Deals that could close this period if a few things go right.
- Pipeline: Open deals that are real but unlikely to close this period.
If you're still choosing a tool for this, our revenue forecasting software guide covers what to look for.
Also track what changed week over week. A change log shows which deals moved in or out of commit, which amounts changed, and which close dates slipped. That's often more useful than the total, because it tells you what moved the number.
Common Room's Forecast gives you a drillable forecast view in one hierarchical grid. You can drill from CRO to rep to deal, and inline edits write straight back to the CRM record. Managers can review a team's commits to see the deals behind each rep's number before the call.
As our sales analytics guide explains, Forecast includes four forecast analytics lenses. Trends shows whether the team is on plan, and Changes shows what moved the number. Accuracy shows how close past calls were, and Pacing shows what's needed to close the gap.
Forecast runs standalone on your existing CRM data or as part of Zoom Revenue Accelerator. Either way, you don't need to rebuild your pipeline in a spreadsheet each week.
Step 5: Run the Pipeline Review With the Dashboard
A pipeline review is a regular meeting where a manager and reps walk through open deals and the forecast. The dashboard should run the meeting, so nobody spends the first 20 minutes asking for updates.
Use a simple agenda each week:
- Scan team totals: Check the top-line forecast against plan and note what changed since last week.
- Open each rep's commit: Click into the deals behind the number, starting with the rep furthest from plan.
- Review red-flag deals: Focus on deals with two or more red indicators.
- Agree on one action per deal: Name the owner and the date for each action.
- Coach on the pattern: Look for the same weak spot across several deals, like low stakeholder coverage.
Ground each conversation in deal evidence, not self-reported confidence. If a rep calls a deal commit, look for evidence from buyer conversations that backs it up.
Step 5 is also where coaching happens, and many reps don't get enough of it. Salesforce's State of Sales research also found that among Gen Z reps, "46% rarely get feedback on their sales conversations."
When a pattern shows up, coach on it right away. If three of a rep's deals rely on one contact, talk through multi-threading across the buying group before the next review.
Hold the review weekly. That's often enough to catch a slipping deal while there's still time to act, and not so often that the numbers barely move.
Example Sales Dashboard Layout
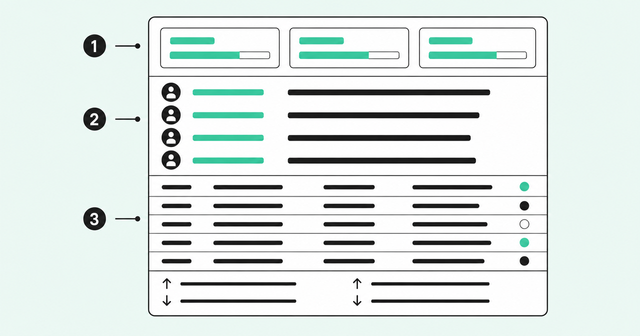
You don't need a long list of tools to start. You need a layout that puts rep performance and deal health on the same screen, connected by the deal list.
Here's a sample sales performance dashboard with four zones, from top to bottom.
| Zone | What It Shows | Who Uses It Most |
|---|---|---|
Top row: team totals | Commit, best case, and pipeline vs. plan, plus closed revenue to date | Execs and managers |
Middle: rep rows | One row per rep with quota attainment, win rate, meetings held, and pipeline created | Managers |
Drill-down: deal list | Each rep's deals with stage, amount, close date, and green, yellow, or red health indicators | Managers and reps |
Bottom: change log | Deals that moved categories, changed amount, or slipped a close date since last week | Managers and RevOps |
Different roles need different starting points, even on the same dashboard:
- Reps: Start at their own deal list and fix red indicators before the review.
- Managers: Start at rep rows, then drill into the deals behind each commit.
- Execs: Start at team totals and the change log to see what moved the number.
Common Sales Dashboard Mistakes to Avoid
Even a well-planned sales metrics dashboard can drift. Watch for these five mistakes:
- Metric sprawl: Adding every metric someone asks for. Keep it to four to six rep metrics and four deal indicators.
- Counting activity volume: Rewarding emails sent instead of meetings held and stages converted.
- No thresholds: Showing numbers without green, yellow, and red rules, so nobody knows what needs action.
- Disconnected reviews: Building a dashboard that nobody opens in the pipeline review.
- Stale data: Letting duplicates, old close dates, and missing contacts pile up in the CRM.
Frequently Asked Questions About Sales Dashboards
How Do You Measure Rep Performance and Deal Health in One Analytics Dashboard?
Pick four to six rep metrics and four deal health indicators, then connect your CRM and activity data so both use the same records. Link each rep's forecast number to the deals behind it, so you can drill from the rep to each deal's health.
Can Managers See the Specific Deals Behind a Rep's Forecast Number Before a Pipeline Review?
Yes, if the dashboard rolls up commit, best case, and pipeline by rep and each number opens the deal list behind it. Common Room's Forecast lets managers review a team's commits and drill from CRO to rep to deal.
What Should You Look for in a Sales Analytics Platform Before Buying?
Look for drill-downs from forecast to deals, buyer-side engagement data, clean CRM sync, and edits that write back to the CRM. You can compare sales analytics tools against those needs before you choose.
What Are the 5 Key KPIs in Sales?
A practical starting set is quota attainment, win rate, pipeline coverage, sales cycle length, and average deal size. Pipeline coverage is the value of open pipeline divided by the quota still left to close.
How Often Should Sales Dashboards Be Reviewed?
We recommend reviewing deal-level health weekly in the pipeline review and looking at rep trends monthly or quarterly. Reps should check their own deal list before each weekly review.
Should Every Rep Have the Same Dashboard as Their Manager?
Reps and managers can share one dashboard, but each should start in a different place. Reps start at their own deals, while managers start at rep rows and drill down.
Bring Rep Performance and Deal Health Into One View
A useful sales dashboard connects how your reps sell to what's real in their deals. Pick a short set of rep metrics, define deal health indicators, and connect clean CRM and activity data. Then build drill-downs from forecast to deals and run your weekly pipeline review from that one view.
Want to see the deals behind every rep's number before your next forecast call? Request a demo.